


January 27, 2021
Leading Indicators
Today was the first day in 2 weeks I've worked more than an hour and a half. There's been an astonishing drop in volume at my work over the last 2 weeks. There always is a severe drop after Christmas, but before Christmas we had Christmas level volume because of the COVID restrictions...which have gotten much more onerous during that time.. Now I'm not laid off, I have sufficient seniority that when they lay people off I can volunteer to be one of them and I've had errands, family issues and doctors appointments so I've taken advantage of that several days, but we're still very short of volume. Even in slack years, even in January, we did not finish unloading packages after an hour and a half on a nominally 4-5 hour shift.
Given the increasing intensity of he lockdowns and the volume of vaccines that we were getting before this week, one would expect a heavier than normal January. Indeed the first two weeks of the month (which in my 28 years of experience are usually dead) were remarkably heavy.
In general the end of January and beginning of February are a bit heavier than most of the post-Christmas winter since stores are restocking their inventory. However, this is the very time that we're seeing volume DROP.
One shipping center is not representative of the company, let alone the economy. In fact it's a ridiculously inadequate data point, but it is concerning, and the lack of pay is of some personal concern.
U.S. economic numbers lag a fair bit in relation to the current time, so I checked out the Baltic Dry Index, which is a current measure of the cost of international shipping. It is an imperfect metric, particularly now as COVID restrictions have likely added considerable overhead to shipping costs, but in general it is a leading indicator of how robust world trade is, the lower the cost the less trade is happening.
However, the BDI is an indicator of bulk raw material shipping prices, not retail. It proceeds in fits and starts with production.
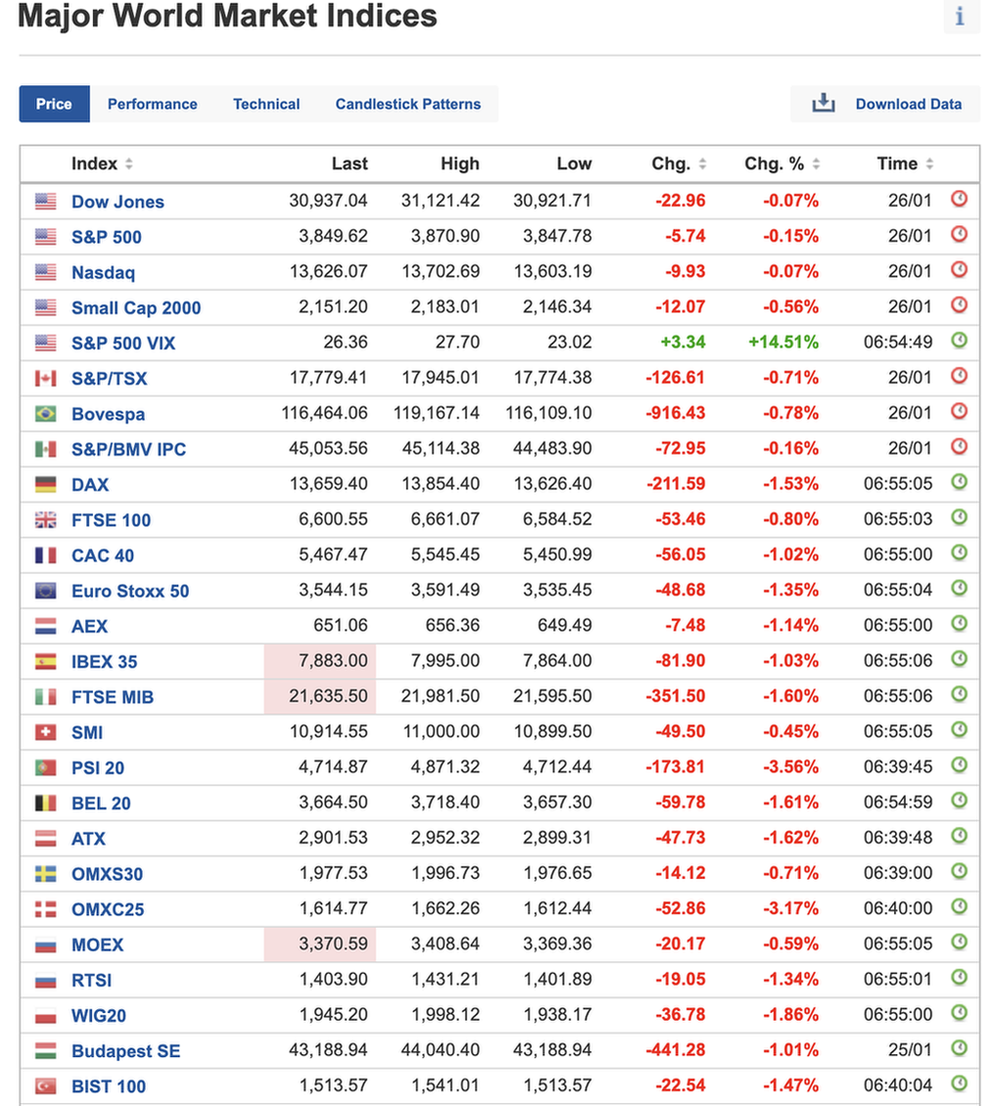
Other leading indicators are at the precise moment that I type this, on a generally downward trend, but I don't know enough to say if it is precipitously so.
Note that that is a screenshot of an active, constantly updating chart that has one or two indices occasionally switching between red and green.
The sudden, unexpected drop in volume from its aberrant and bonecrushing highs to lay-offs where I am may be a localized phenomenon and should not be a cause for undue concern.
A focus group of one is a woefully inadequate data set.
However, in my 28 years of experience our volume trends quite closely with the overall economic health of the nation, so I'm very curious if anyone else here has noted any drop-offs in economic activity.
Posted by: The Brickmuppet at
07:08 AM
| Comments (1)
| Add Comment
Post contains 490 words, total size 4 kb.
1
Aww man, I just ordered some ammo yesterday and selected the FedEx option on the account of your back.
Posted by: Pete Zaitcev at Wed Jan 27 10:37:36 2021 (LZ7Bg)
24kb generated in CPU 0.0229, elapsed 0.0894 seconds.
70 queries taking 0.0763 seconds, 194 records returned.
Powered by Minx 1.1.6c-pink.
70 queries taking 0.0763 seconds, 194 records returned.
Powered by Minx 1.1.6c-pink.

